
Real market analysis starts exactly where the public relations narratives break down. Corporate treasuries routinely hide structural vulnerabilities under the guise of “strategic asset optimization,” using complex accounting wrappers to mask raw balance sheet strain. When spot Bitcoin ETFs log nine consecutive days of net outflows—the most sustained institutional contraction since their January 2024 inception—market sentiment becomes completely irrelevant. You ignore the commentary and audit the cold, immutable data inside the regulatory filings.
What follows isn’t a crypto price prediction. It’s a cold look at verified data points. The numbers reveal a structural exit among big-money allocators, a corporate treasury model cracking under the weight of its own leverage, and a widening chasm between retail and institutional behavior. The numbers are too large to dismiss, and the pattern is too clear to ignore.
1. The Nine-Day Hemorrhage: Mapping the ETF Outflow Architecture
Between May 15 and May 29, 2026, U.S.-listed spot Bitcoin ETFs logged nine consecutive days of net outflows, pulling roughly $2.84 billion out of the space. While this broke the previous record of eight straight outflow days set back in February 2025, the dollar total remains just below the $3.2 billion lost in that earlier cycle, according to verified tracking data from Farside Investors and SoSoValue.
BlackRock’s iShares Bitcoin Trust (IBIT) bore the brunt of the liquidation. The fund shed roughly $2.04 billion in net redemptions during the streak, accounting for 72% of the entire category’s outflows. On May 27 alone, IBIT posted a single-day outflow of $527.8 million, missing its all-time single-day redemption record by less than half a million dollars.
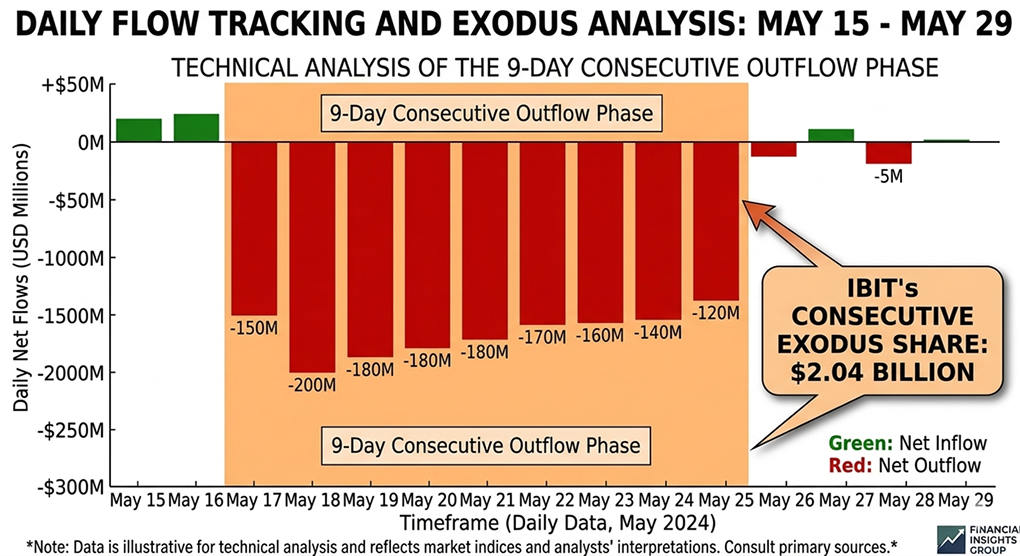
A massive dark pool block trade of 29.2 million IBIT shares—valued at $1.3 billion—preceded the unwind, driving total Bitcoin ETF volume to $4.4 billion for that single session.
The retreat spared almost no one. Grayscale’s GBTC tacked on $104.8 million in outflows, while Fidelity, Bitwise, and Ark & 21Shares all bled capital. Only Morgan Stanley’s MSBT managed a positive day, pulling in a negligible $4.3 million. May 2026 closed with $2.1 billion in total withdrawals—the largest monthly outflow of the year—pushing U.S. spot Bitcoin ETFs into negative territory year-to-date with a net loss of $596 million.
The damage wasn’t isolated to Bitcoin either; U.S. spot Ether ETFs clocked 13 consecutive days of outflows between May 11 and May 29, dropping roughly $694 million. The takeaway is clear: the institutional ETF bid is no longer automatic.
2. The Leverage Divergence: Retail Longs vs. Institutional Exits
While the ETF channel shows capital exiting, the derivatives market shows where the underlying vulnerability lies. Following a massive $766 million liquidation event on May 23, global futures open interest dipped below $55 billion—a 14% drop from the leverage peaks seen when Bitcoin traded north of $80,000.
Normally, a leverage flush like this requires at least a week of flat-to-negative funding rates to reset the market floor. That reset never happened. Within 72 hours, perpetual funding rates aggressively snapped back to an overheated median of +10.95% annualized across major exchanges.
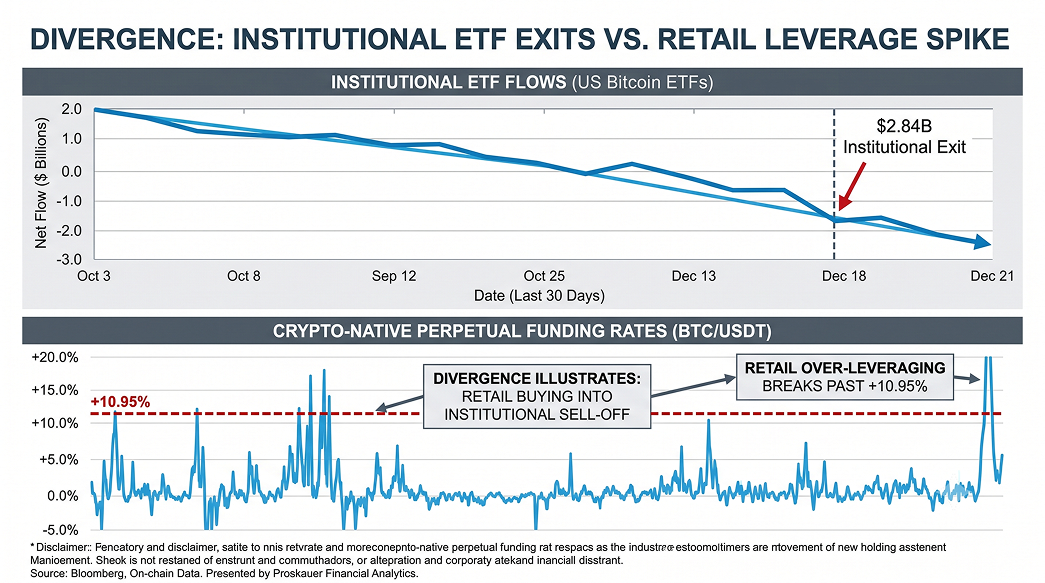
The critical detail here is that this leveraged long demand is entirely driven by retail traders on crypto-native exchanges. The Chicago Mercantile Exchange (CME)—the primary venue for institutional futures—shows no matching buildup. Simultaneously, the Coinbase Premium Gap plunged to roughly -$140 (or -18 basis points), marking ten straight days of decline.
In a mature, post-ETF market, this specific divergence tells an explicit story: direct U.S. spot demand on Coinbase has dried up, while retail funding rates are running dangerously hot. The options market is aggressively pricing in this downside risk. The one-month 25-delta risk reversal for the June 26 expiry hit -5.7% implied volatility, meaning puts are commanding a premium over calls last seen during the sharp February drawdowns.
With billions in options contracts expiring and CoinGlass data already confirming hundreds of millions in long liquidations, retail capital is reloading leverage into the exact channel that institutions are using to exit.
3. The Corporate Treasury Dilution Spiral: Strategy’s Balance Sheet Under the Microscope
If the ETF channel represents the demand drain, corporate treasuries expose the structural supply-side risk. In Q1 2026, public companies holding Bitcoin on their balance sheets reported combined losses exceeding $13 billion. The core of this deficit belongs to Strategy (formerly MicroStrategy), which posted a staggering quarterly net loss of $12.54 billion—driven by $14.46 billion in mark-to-market unrealized Bitcoin losses.
On June 1, 2026, Strategy executed its first Bitcoin sale since December 2022, liquidating 32 BTC for roughly $2.5 million at an average price of $77,135. While the company executed this slightly above its internal cost basis of $75,699, the destination of the cash is what matters: it was used to fund preferred stock dividends due on June 30.
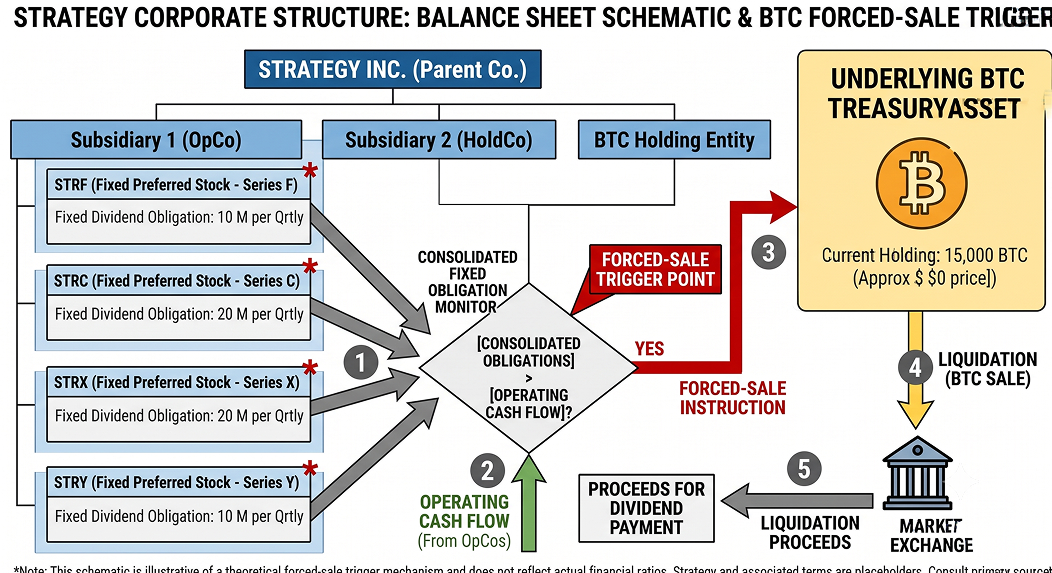
With multiple series of preferred stock (STRF, STRC, STRK, STRD, and STRE) carrying fixed payout mandates, this sale was not a tactical rotation. Per the company’s own SEC 8-K filing, it was a forced cash flow action to meet structural liabilities. The market responded immediately: MSTR shares dropped to $159.09, trading roughly 65% below their 2025 all-time highs and pushing the equity to a discount relative to the net asset value (NAV) of its Bitcoin holdings.
This is the definition of the corporate dilution spiral. In a bull market, the loop compounds to the upside: rising asset values expand share premiums, making it cheap to raise capital and buy more assets. In a downturn, the loop reverses with identical force: asset values shrink, equity premiums vanish, and meeting fixed debt or dividend obligations requires diluting existing shareholders or selling the underlying asset.
With public corporations now holding 1.2 million BTC—roughly 5.5% of the total circulating supply—and many using that asset as loan collateral, any acceleration of this dilution spiral turns a corporate balance sheet problem into a systemic market overhang.
4. The Sovereign Directive
This analysis isn’t an argument for or against Bitcoin. It is a look at the structural mechanics of capital. The nine-day ETF outflow streak, the retail-institutional leverage divergence, and the corporate treasury dilution spiral are verified data points pulled straight from SEC filings, Farside Investors, CoinGlass, and Deribit.
When corporate boards deploy balance sheet manipulation to gloss over structural liabilities, your only real defense is math. Treat the data with the cold precision of someone who reads the filings they hoped you would never open. Your financial sovereignty isn’t granted by the market; it is extracted from it, one data point at a time.

The $2.84 Billion Bitcoin ETF Liquidation: A Balance Sheet Dissection
Nine days of outflows. $2.84 billion withdrawn. The institutional bid is no longer automatic.